Sketch the Graph of y=sec2x
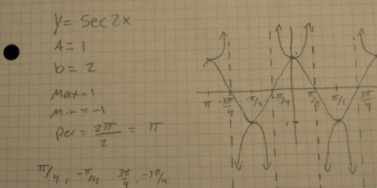
y=sec2x
A=1 because there is no number in front of the secant so it is 1
b=2 the b is the number after the secant and its 2
Max= 1
Min= -1
Per= 2pi/b= 2pi/2, the 2's cancel to give you pi
Now divide pi by 2..so pi/2 to give you where the half point of your graph will be. If you started with a peak, this point will be a trough and visa versa.
Now go half way between your period and pi/2 to get your x-intercepts. x int= pi/4,
-pi/4, 3pi/4, -3pi/4
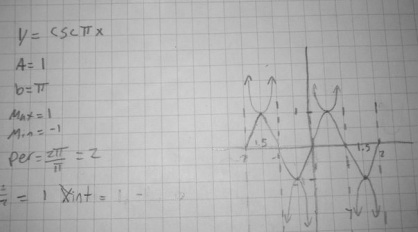
Sketch the graph of y=cscPIx
A=1
b=pi
Max=1
Min=-1
Per= 2pi/pi, per=2
x intercepts= 1,2, -1, -2
b=pi
Max=1
Min=-1
Per= 2pi/pi, per=2
x intercepts= 1,2, -1, -2
y=3cscx
Now you try!
